IDApyView
IDApyView is a comprehensive modernization of IDL's IDAView software, ported to Python 3 for plasma physics research. This PyQt5-based GUI application enables scientists to visualize and analyze multi-dimensional plasma diagnostic data from the ASDEX Upgrade tokamak at the Max Planck Institute for Plasma Physics. It handles various diagnostic systems including IDA, IDI, IDZ, and LIN, providing real-time data exploration through interactive time sliders and specialized analysis windows.
Gallery
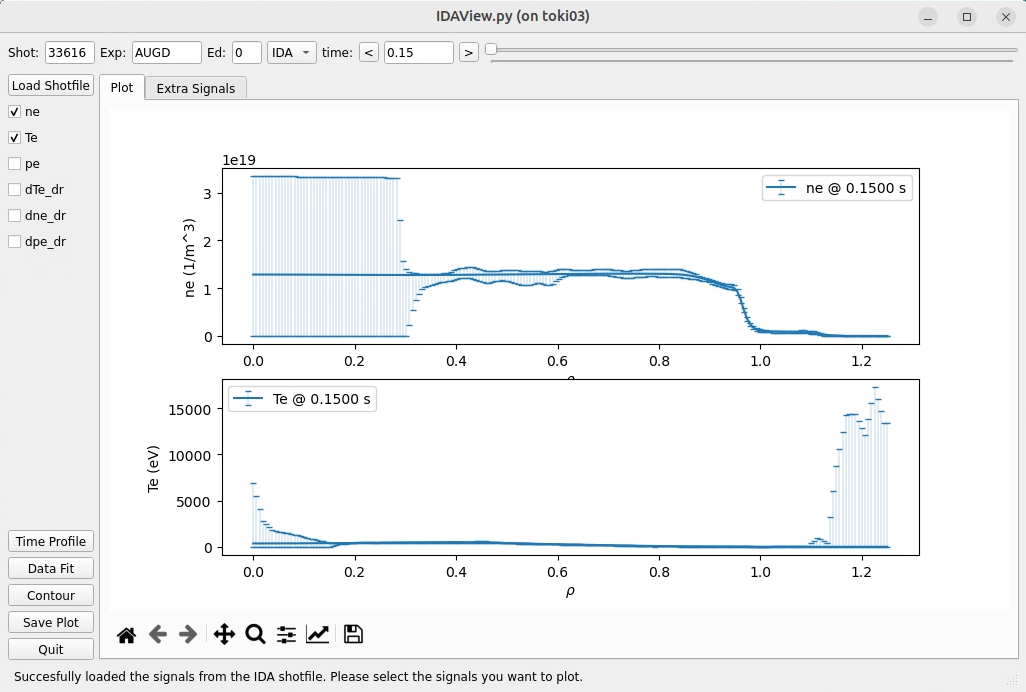
Main application window showing signal selection and time navigation
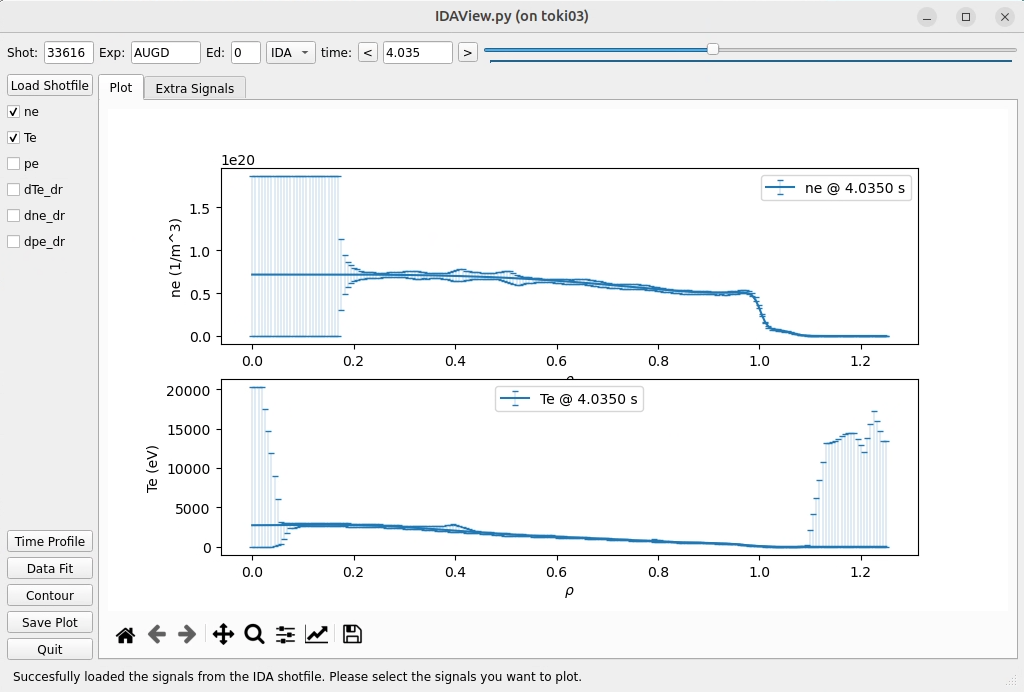
Different time selected for the same discharge changed through the slider feature
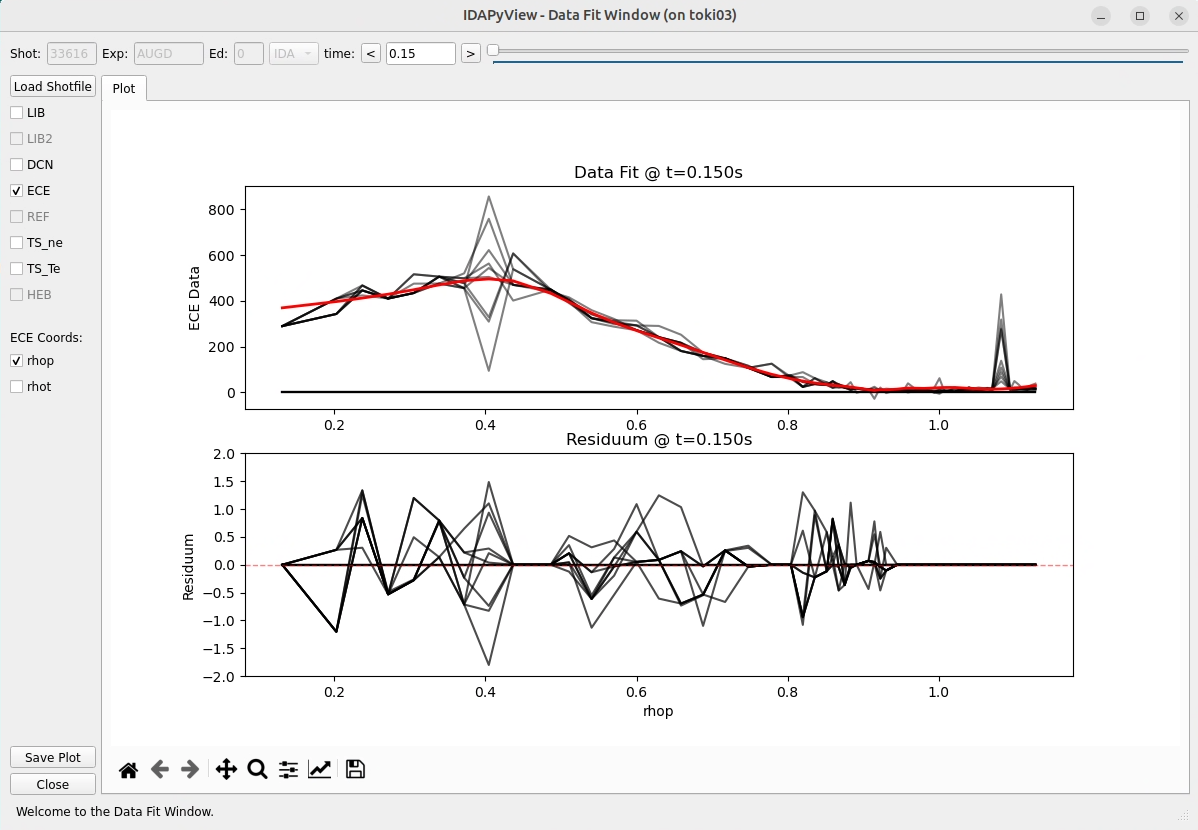
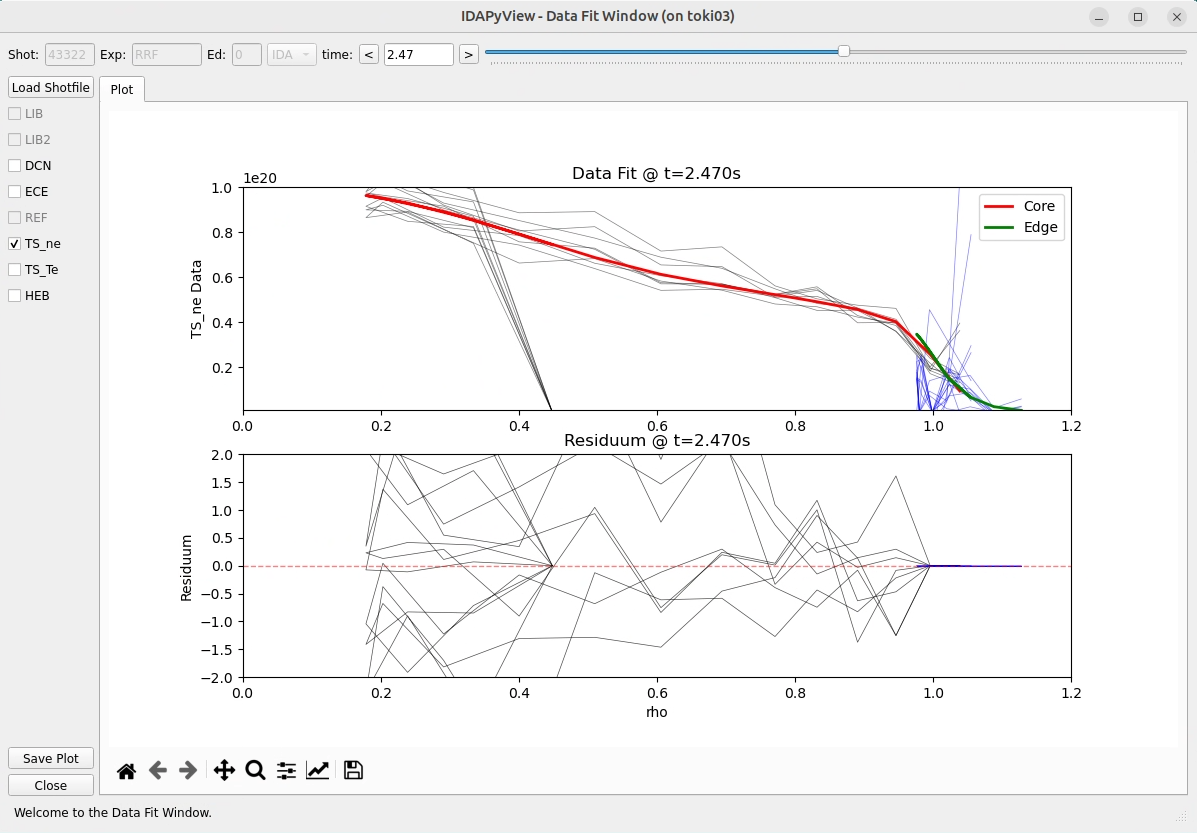
Specialized window for model vs. measurement comparisons
Thomson scattering diagnostic data with model fitting
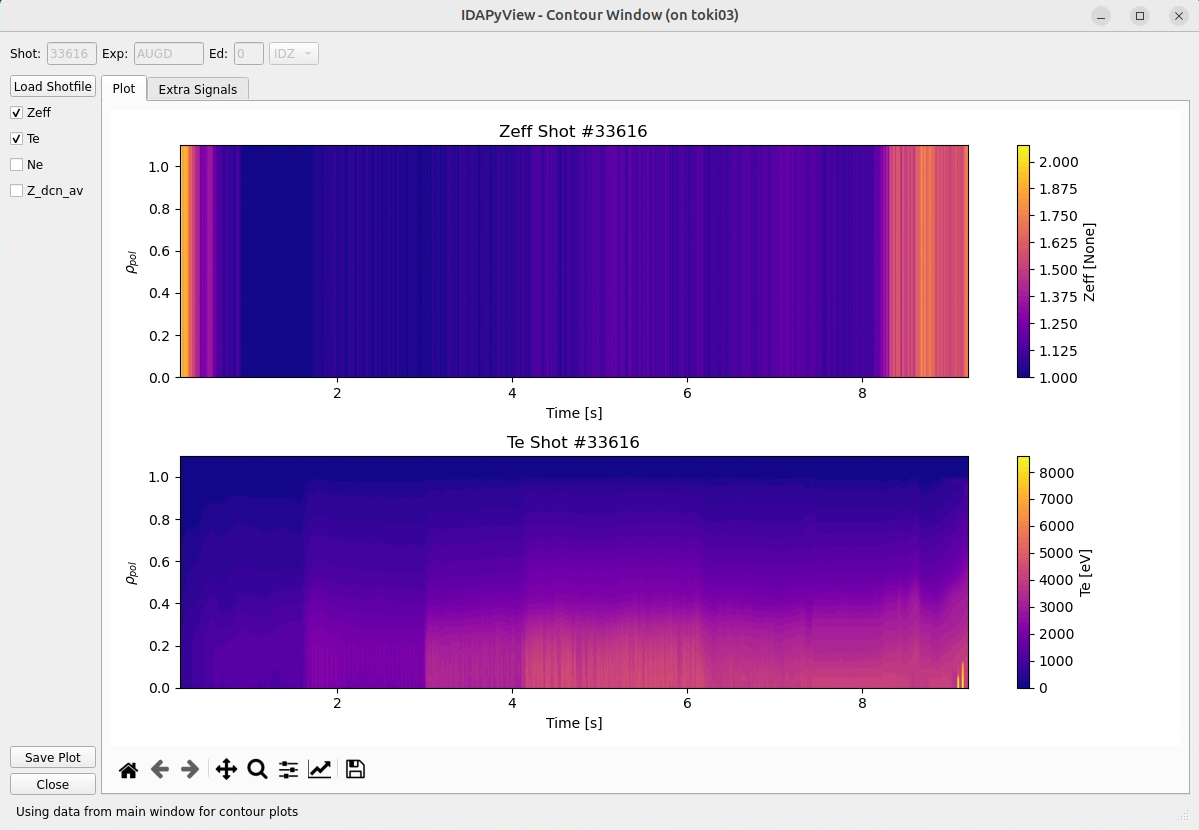
2D spatial-temporal contour plots for plasma analysis
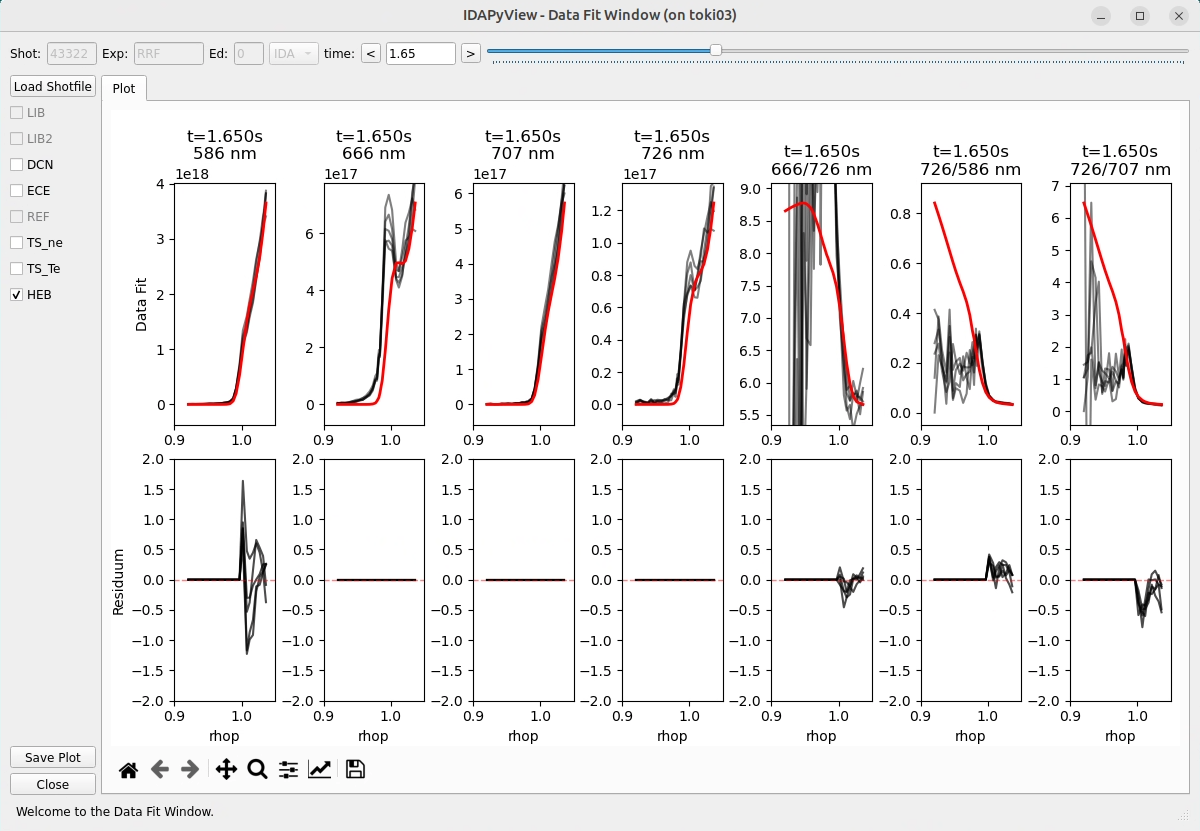
Helium Beam diagnostic data with model fitting
Project Overview
IDApyView represents a comprehensive modernization effort to bring the beloved IDL-based IDAView software into the Python ecosystem. The project emphasizes three key principles: extensibility, usability, and error robustness. As a scientific visualization tool specifically designed for plasma physics research, it focuses on data analysis from tokamak fusion devices while maintaining the familiar workflow researchers expect.
Architecture Design
The application follows a modular architecture built around several key components: the main application framework managing global state and window lifecycle, a comprehensive data layer interfacing with ASDEX Upgrade's shotfile system, and specialized visualization windows for different analysis modes. Each diagnostic type has its own handler with plotting engines optimized for specific measurement types.
Key Features Implementation
The software provides dynamic signal loading from ASDEX Upgrade's shotfile system, with each diagnostic type having specialized handlers for optimal visualization. Real-time interactive updates ensure efficient data updates without full replotting when users navigate through time. The comprehensive uncertainty visualization system supports different error bar types, while the modular design allows easy addition of new diagnostic systems for future research needs.
Performance Optimizations
The application implements several performance optimizations including lazy loading of data only when needed, efficient updates where time slider changes only update necessary plot elements, proper memory management with cleanup of matplotlib objects, and debounced interactions to prevent excessive updates during rapid user input. These optimizations ensure smooth operation even with large plasma diagnostic datasets.
Scientific Impact
IDApyView successfully modernizes plasma physics data visualization while maintaining the familiar workflow that researchers expect from the original IDL version. Its modular architecture ensures extensibility for future diagnostic systems, while the Python ecosystem provides robust scientific computing capabilities. The software serves as an excellent example of how legacy scientific tools can be effectively modernized without sacrificing functionality or user experience, supporting ongoing research on fusion devices.
Core Application Structure
# Main Application Framework
AppWindow (IDAView.py)
├── Main Application Controller
│   ├── Global State Management
│   │   ├── shotnumber, exp, edition, diag, data_loaded
│   │   ├── data: Dictionary of loaded Signal objects
│   │   └── windows: List of open window references
│   ├── Window Management
│   │   ├── Main window (window class) creation
│   │   ├── Child window spawning
│   │   └── Configuration persistence
│   └── Event Handling
│       ├── Application close event
│       └── Window lifecycle management
│
├── Data Layer (sigobj.py)
│   ├── Dataset
│   │   ├── from_sig_types(): Factory method for shotfile loading
│   │   ├── Signal aggregation from ASDEX Upgrade shotfiles
│   │   ├── Unifying formatting and dimensionality order
│   │   └── Integration with aug_sfutils
│   ├── Signal: Individual measurements
│   │   ├── 1D data arrays with time evolution
│   │   ├── Metadata and coordinate information
│   │   └── Type identification
│   └── SignalGroup: Spatial profile collections
│       ├── 2D/3D/4D data arrays (space,time,channels, etc.)
│       ├── Areabase coordinate handling
│       └── Profile-specific processing
│
├── Main Window Interface (window class in IDAView.py)
│   ├── User Input Controls
│   │   ├── Shot/experiment/edition inputs
│   │   ├── Diagnostic selection dropdown
│   │   └── Load button with auto-load functionality
│   ├── Dynamic Signal Selection
│   │   ├── Checkbox generation from loaded signals
│   │   ├── Favorite signal auto-selection
│   │   └── Extra signals tab (utils.py)
│   ├── Interactive Plotting
│   │   ├── Matplotlib canvas integration
│   │   ├── Time slider with synchronized updates
│   │   ├── Multi-subplot generation
│   │   └── Real-time plot updates via on change _update_data()
│   └── Window Spawning
│       ├── Time Profile button → wind_t_prof.py
│       ├── Data Fit button → wind_data_fit.py
│       └── Contour button → wind_contour.py
│
├── Specialized Analysis Windows
│   ├── Time Profile Window (wind_t_prof.py)
│   │   ├── Temporal evolution analysis
│   │   └── Rho-coordinate interpolation
│   ├── Data Fit Window (wind_data_fit.py)
│   │   ├── Model vs. measurement comparison
│   │   ├── Signal handler integration
│   │   └── Residuum analysis plotting
│   └── Contour Window (wind_contour.py)
│       ├── 2D spatial-temporal visualization
│       └── SignalGroup-specific processing
│
├── Signal Handler System (signal_handlers/)
│   ├── Factory Pattern (get_signal_handler() in factory.py)
│   │   ├── Automatic handler selection
│   │   ├── Handler instantiation and caching
│   │   └── Fallback to standard handler
│   ├── Base Handler (base_handler.py)
│   │   ├── Abstract interface definition
│   │   ├── Common plotting infrastructure
│   │   └── Shared utility methods
│   └── Specialized Handlers
│       ├── Standard Handler: Default multi-profile plotting
│       ├── IDI Handler: Interferometry with model fitting
│       ├── IDZ Handler: Z-effective measurements
│       ├── HEB Handler: 7x7 spectral grid layout
│       ├── TS Handler: Thomson scattering dual signals
│       └── ECE Handler: Channel-to-rho conversion
│
├── Configuration Management (config.py)
│   ├── Easy extendability for future additions
│   ├── DIAGS_AND_FAVS: Diagnostic-to-favorites mapping
│   ├── TIMEBASES: Signal-to-timebase mapping
│   └── Default parameters and styling
│
├── Utility Functions (utils.py)
│   ├── Plot management helpers
│   ├── Data processing utilities
│   └── UI state management
│
└── Error Handling (exceptions.py)
    ├── ShotfileNotFoundError: Missing data handling
    ├── Graceful error recovery
└── User feedback via status messages- 1Multi-diagnostic support (IDA, IDI, IDZ, LIN)
- 2Real-time interactive time slider navigation
- 3Multiple specialized visualization windows
- 4Dynamic signal loading from ASDEX Upgrade shotfiles
- 5Comprehensive error bar and uncertainty visualization
- 6Persistent user preferences and favorite signals
- •Porting legacy IDL code to modern Python architecture
- •Handling large plasma diagnostic datasets efficiently
- •Creating intuitive multi-window interface for scientists
- •Implementing modular design for future extensibility
- •Managing real-time updates without performance loss
- •Advanced PyQt5 GUI development and architecture
- •Scientific data visualization with Matplotlib
- •Plasma physics diagnostic systems and data structures
- •Memory-efficient handling of large numerical datasets
- •Modular software design for scientific applications